# Industry Overview

Industry Overview offers a range of panels that cover various aspects of the industry, allowing users to stay up to date with recent news, understand the industry's scale and growth, analyze macroeconomic trends, identify top industry players, and gain insights into business allocation based on operating status, size, years of operation, and province.

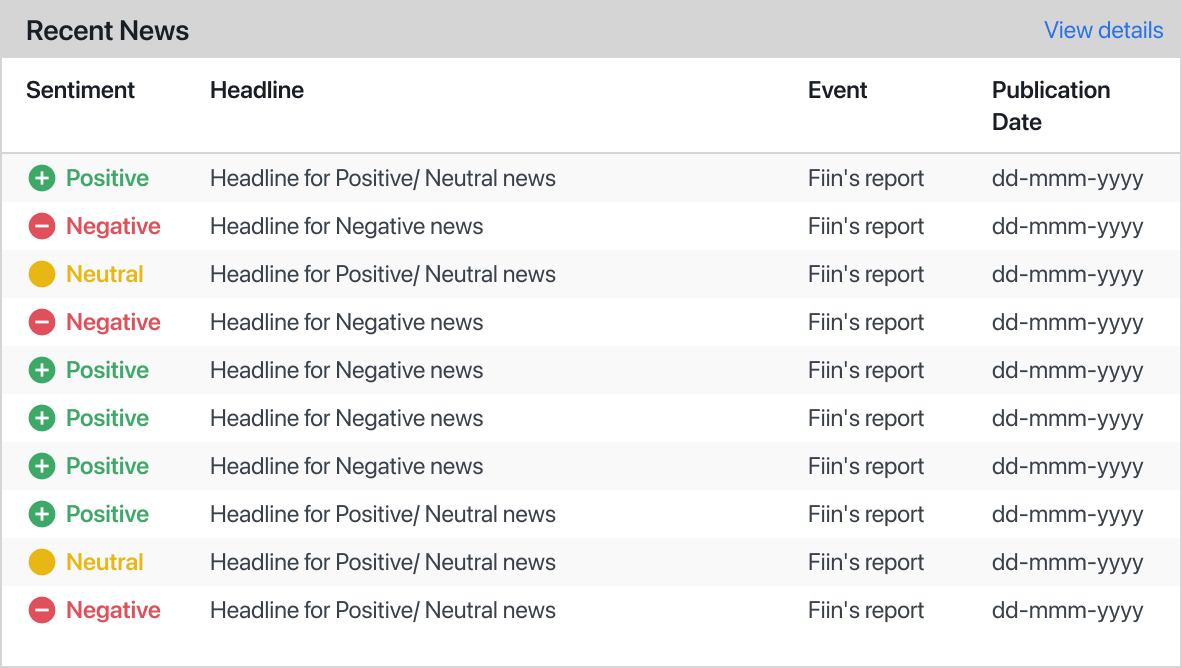
1. **Recent News**:&#x20;

This panel is dedicated to displaying the most recent news articles that are relevant to the company's main business. It serves as a valuable resource for users to stay informed about the latest developments, market trends, and industry updates. The news articles are carefully curated to provide users with timely and relevant information.

<figure><img src="/files/J65ztomOsmlqeErwS2AK" alt="" width="563"><figcaption><p>Figure 1: Recent News</p></figcaption></figure>

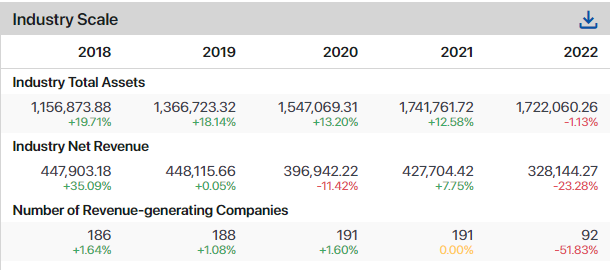
2. **Industry Scale:**&#x20;

The Industry Scale panel presents a comprehensive overview of the industry's growth and performance over the past five years. It includes key metrics such as total assets, net revenue, and the number of businesses operating in the industry.

<figure><img src="/files/wTAM42uLgwKrWnpKjo17" alt=""><figcaption><p>Figure 2: Industry Scale</p></figcaption></figure>

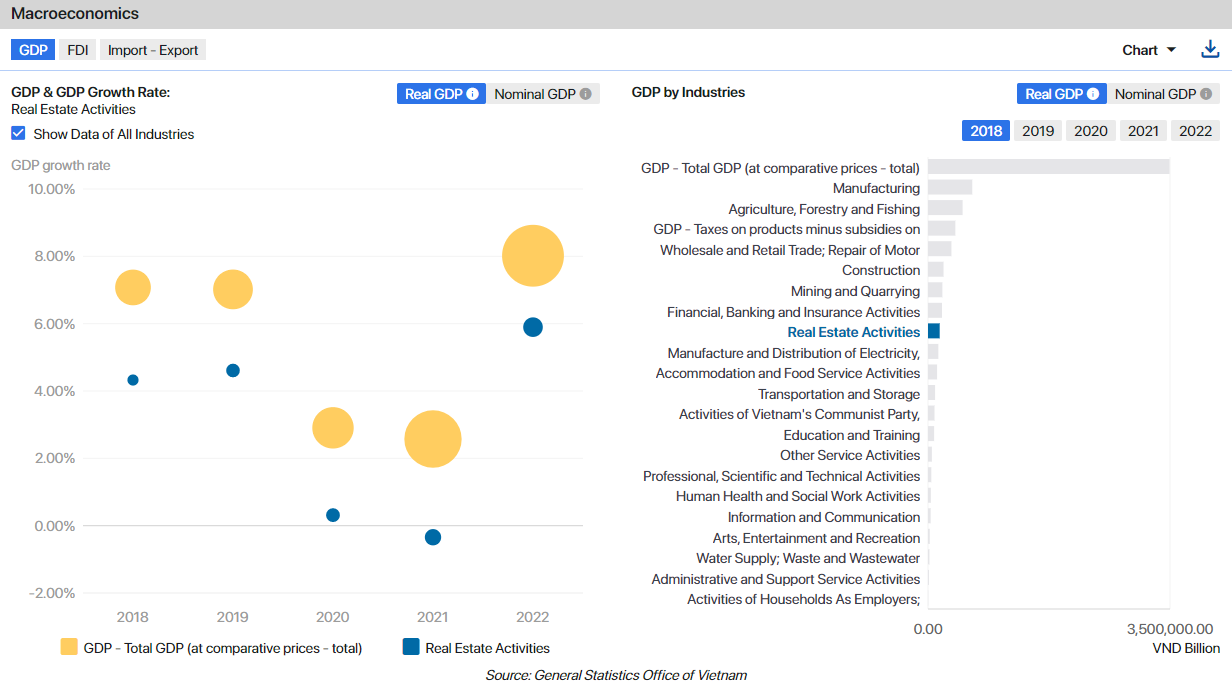
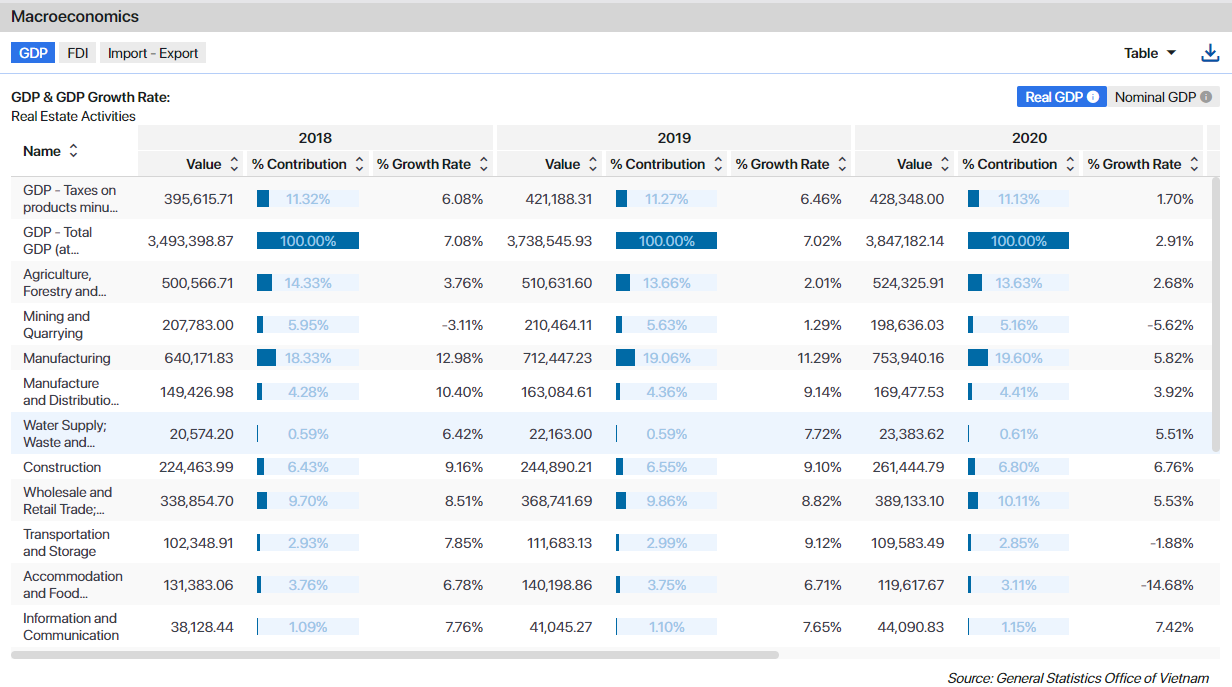
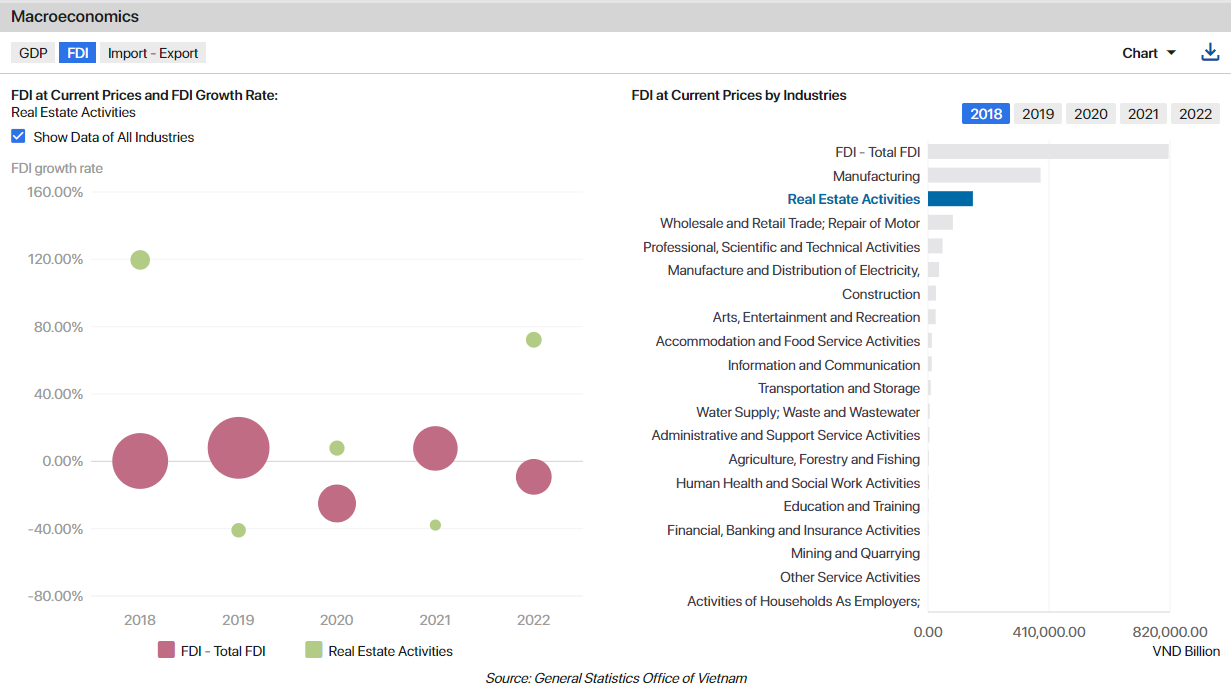
3. **Macroeconomics**

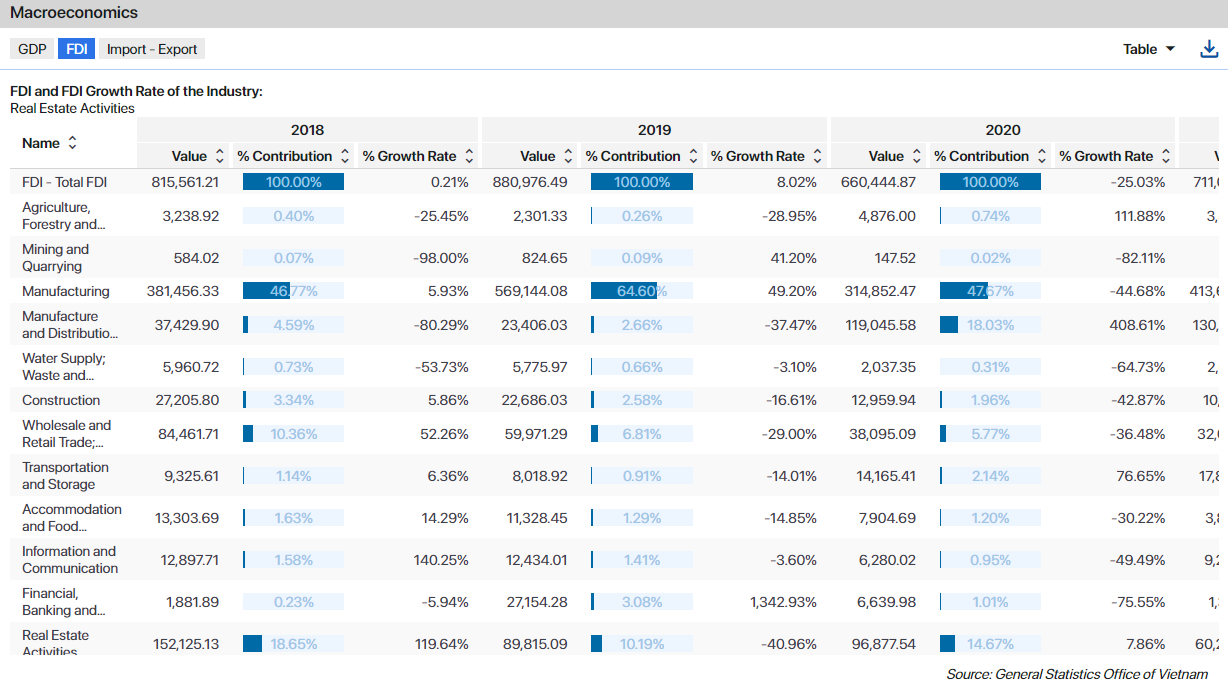
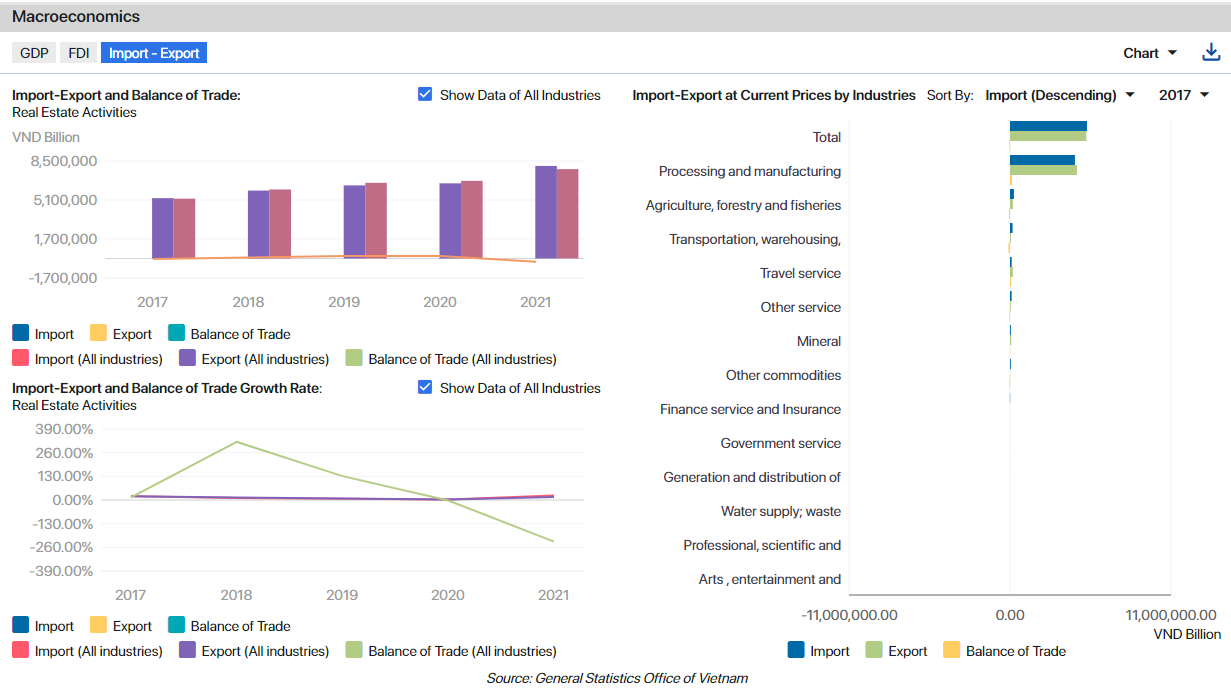
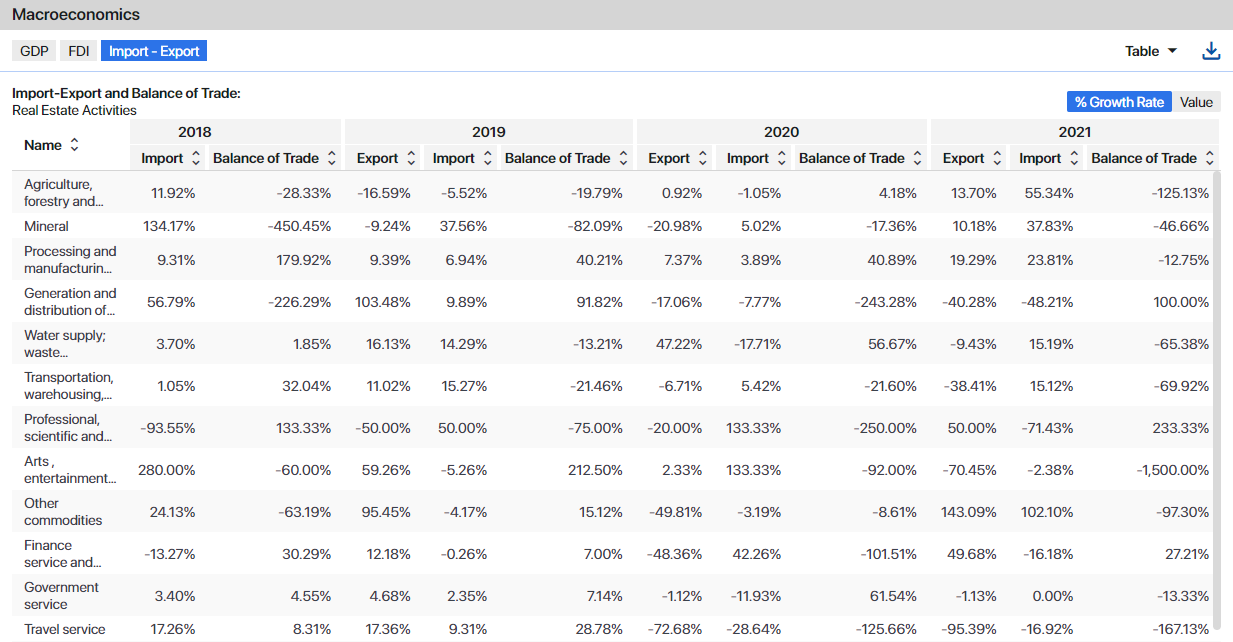
Users can access interactive charts and graphs that depict essential macroeconomic indicators relevant to the industry. This includes data on GDP (Gross Domestic Product), FDI (Foreign Direct Investment), and Import-Export figures.

{% tabs %}
{% tab title="GDP \_Chart" %}

<figure><img src="/files/k6pCX5i4d0M3F5v8HihV" alt=""><figcaption></figcaption></figure>
{% endtab %}

{% tab title="GDP\_Table" %}

<figure><img src="/files/ZIDilEJqI4N17NX58owr" alt=""><figcaption></figcaption></figure>
{% endtab %}

{% tab title="FDI\_Chart" %}

<figure><img src="/files/sg7AgBOi4xBThhLtnDAl" alt=""><figcaption></figcaption></figure>
{% endtab %}

{% tab title="FDI\_Table" %}

<figure><img src="/files/a7sp3Xbigu1yDxjAnfYK" alt=""><figcaption></figcaption></figure>
{% endtab %}

{% tab title="Import-Export\_Chart" %}

<figure><img src="/files/S1IQgM7PamtwGUxOXwy2" alt=""><figcaption></figcaption></figure>
{% endtab %}

{% tab title="Import-Export \_Table" %}

<figure><img src="/files/w7zq2NKj4VTxgk2cB090" alt=""><figcaption></figcaption></figure>
{% endtab %}
{% endtabs %}

4. **Top Industry Players:**&#x20;

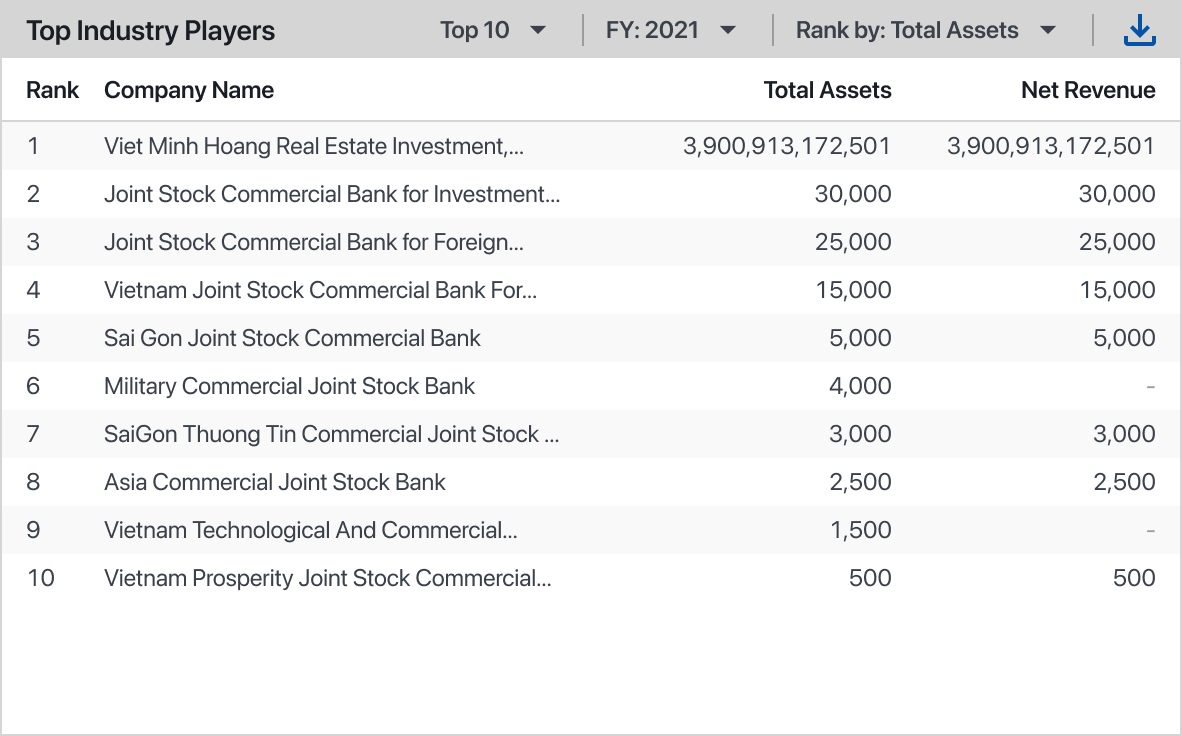
The Top Industry Players panel showcases the leading companies and organizations within the industry. Users can explore a list of the most influential players and delve into their profiles.&#x20;

<figure><img src="/files/UeoB1L69yR2iV9UdINik" alt="" width="563"><figcaption><p>Figure 3: Top Industry Players</p></figcaption></figure>

5. **Business Allocation Panels:**&#x20;

These panels provide users with a detailed breakdown of the industry's businesses based on various factors. These panels include:

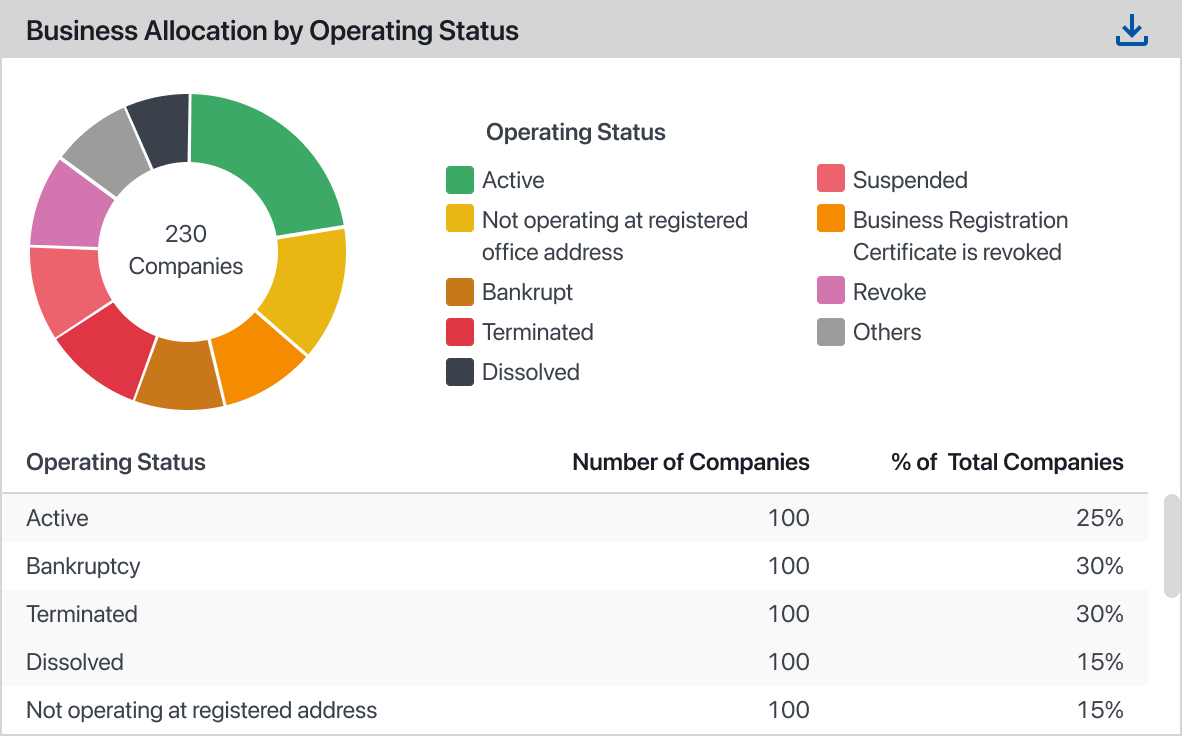
* Operating Status: This panel illustrates the distribution of businesses based on their operating status, such as active, terminated, or closed.

<figure><img src="/files/dms7X41O5OcBZFEqdtBT" alt="" width="563"><figcaption><p>Figure 4: Business Allocation by Operating Status</p></figcaption></figure>

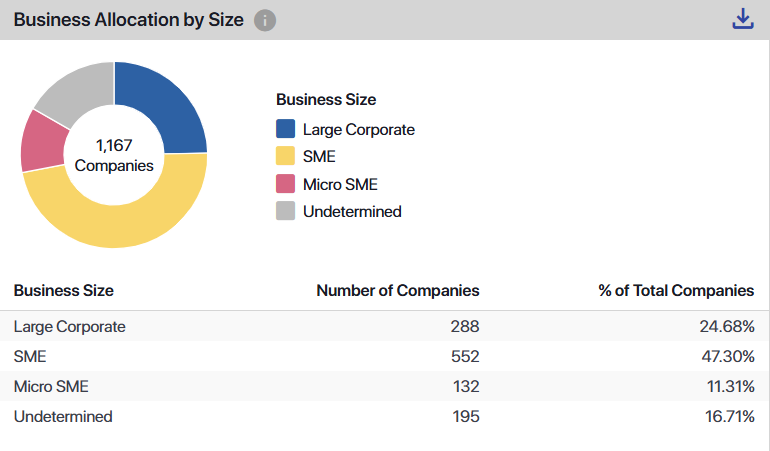
* Size: Users can explore the size distribution of businesses within the industry.

<figure><img src="/files/cbdpMY9ITDaump82crnL" alt=""><figcaption><p>Figure 5: Business Allocation by Size</p></figcaption></figure>

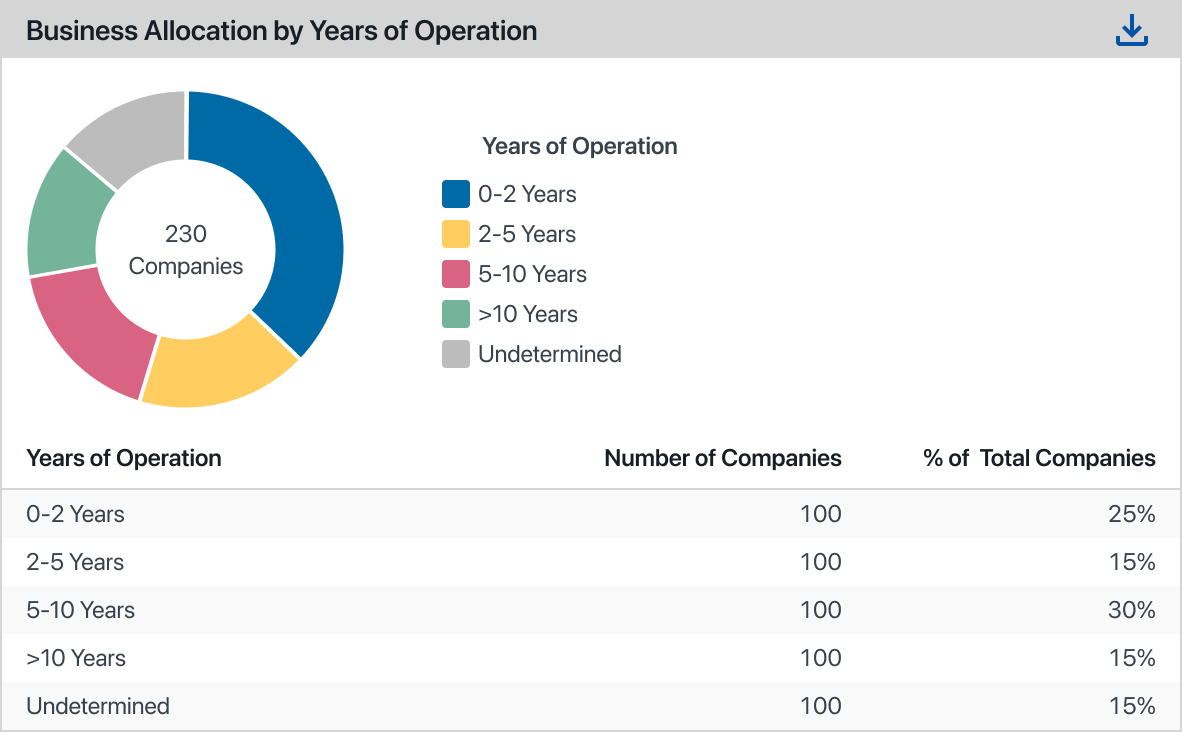
* Years of Operation: The Years of Operation panel provides information on the distribution of businesses according to the number of years they have been operating. Users can analyze the industry's maturity and identify trends based on the longevity of businesses. This information can be valuable when considering partnerships or assessing the stability of the industry.

<figure><img src="/files/8MmK39hESaT3Y6wVg623" alt="" width="563"><figcaption><p>Figure 6: Business Allocation by Years of Operation</p></figcaption></figure>

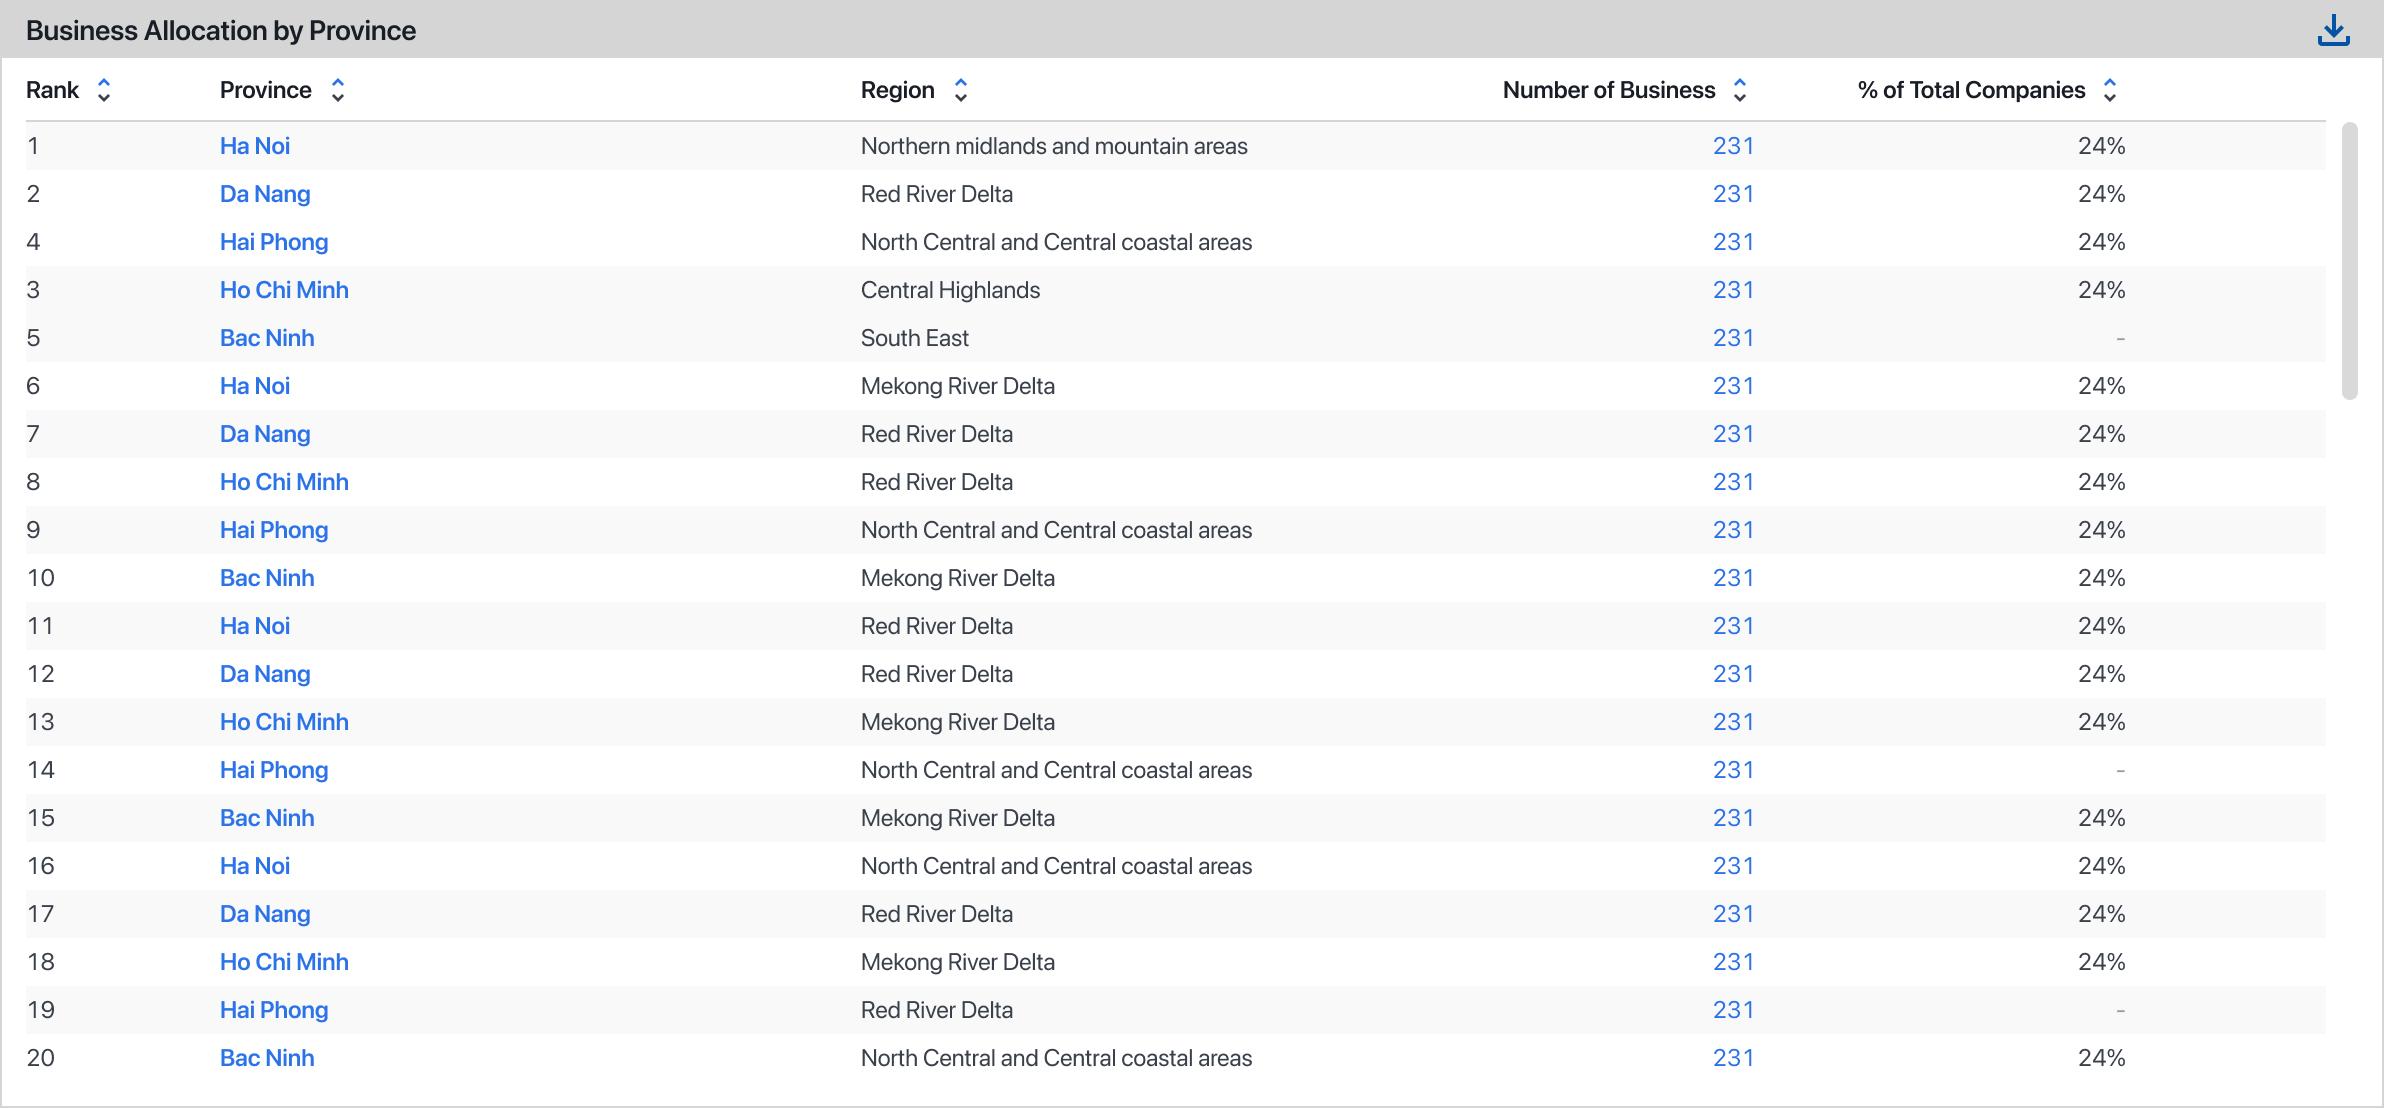
* Province: This panel displays the geographical distribution of businesses within the industry across different provinces or regions. Users can identify the concentration of businesses in specific areas and gain insights into regional dynamics. This information can be useful for targeting specific markets or understanding regional competition.<br>

<figure><img src="/files/XdlTCFffFPXmpI0cDMsc" alt=""><figcaption><p>Figure 7: Business Allocation by Province</p></figcaption></figure>


---

# Agent Instructions: Querying This Documentation

If you need additional information that is not directly available in this page, you can query the documentation dynamically by asking a question.

Perform an HTTP GET request on the current page URL with the `ask` query parameter:

```
GET https://docs.fiingate.vn/manual/user-manual/view-company-information/industry-overview.md?ask=<question>
```

The question should be specific, self-contained, and written in natural language.
The response will contain a direct answer to the question and relevant excerpts and sources from the documentation.

Use this mechanism when the answer is not explicitly present in the current page, you need clarification or additional context, or you want to retrieve related documentation sections.